This is the fifth in a series of posts covering measuring a .Net Core application. If you want to try follow the code then you can have a look at this repo: Blog-Diagnostics.
This is the plan for the series. I will update this with links as it evolves.
- Setting up local diagnostics tools
- Using dotnet-counters
- dotnet-counters with a custom provider
- Using dotnet-gcdump to investigate memory leaks
- Creating a dump file when a ASP.NET Core application crashes
A nice out of the box feature of ASP.NET Core, is that there is a built in way to automatically create a memory dump when the application crashes.
All you have to do is set a few environment variables and it will generate automatically. The full list of available options is available here.
Just to show it working I will just set this Environment variable.
COMPlus_DbgEnableMiniDump=1
I will then update the application to throw an exception in the startup ConfigureServices method.
public void ConfigureServices(IServiceCollection services)
{
	services.AddControllers();
	throw new Exception("Something bad happened");
}
The application crashes as it starts as expected. Now its time to look at the dump file.
This returns the file /tmp/coredump.34121 which was generated. I can then use the dotnet dump tool to run SOS commands on the dump file.
dotnet dump analyze /tmp/coredump.34121
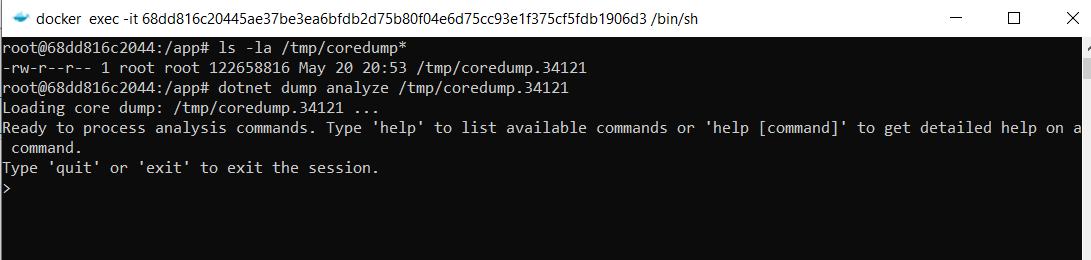
Since I’m looking for the reason that the application crashed, I can just use the print exception (pe) command to see what the last exception was.
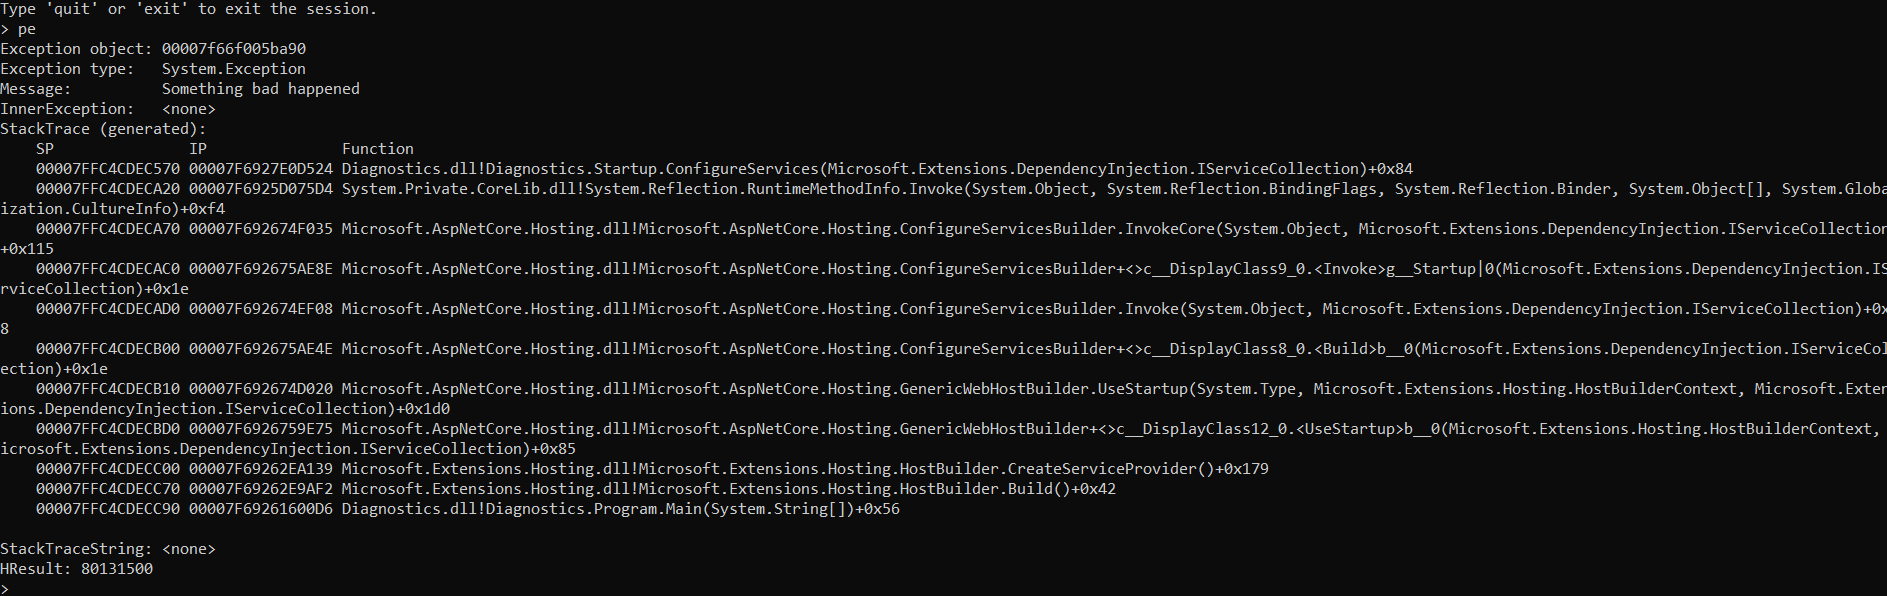
As you can see, this shows the full stack trace of the exception thrown in the Startup class.