This is the fourth in a series of posts covering measuring a .Net Core application. If you want to try follow the code then you can have a look at this repo: Blog-Diagnostics.
This is the plan for the series. I will update this with links as it evolves.
- Setting up local diagnostics tools
- Using dotnet-counters
- dotnet-counters with a custom provider
- Using dotnet-gcdump to investigate memory leaks
- Creating a dump file when a ASP.NET Core application crashes
To simulate a memory leak that may happen in an application, I’ve added a new endpoint that will add Person objects to a concurrent bag. I haven’t implemented Equals and GetHashcode in the Person class and so it will always add a new item. I will use this to show how to investigate a memory leak using the gcdump tool.
public class PersonService : IPersonService
{
	private readonly ConcurrentBag<Person> uniquePeople = new ConcurrentBag<Person>();

	public async Task SaveAsync(Person person)
	{
		await Task.Delay(TimeSpan.FromSeconds(1));

		//.Equals and .GetHashCode aren't implemented so this won't work
		//as expected. The compare on object reference which is never
		//going to match.
		uniquePeople.Add(person);
	}
}

public interface IPersonService
{
	Task SaveAsync(Person person);
}

[Route("api/[controller]")]
[ApiController]
public class PersonController : ControllerBase
{
	readonly IPersonService _personService;
	public PersonController(IPersonService personService)
	{
		_personService = personService;
	}

	[HttpPost]
	public async Task<IActionResult> Post(Person person)
	{
		await _personService.SaveAsync(person);
		return Ok();
	}
}


public void ConfigureServices(IServiceCollection services)
{
	services.AddControllers();

	services.AddSingleton<IPersonService, PersonService>();
}
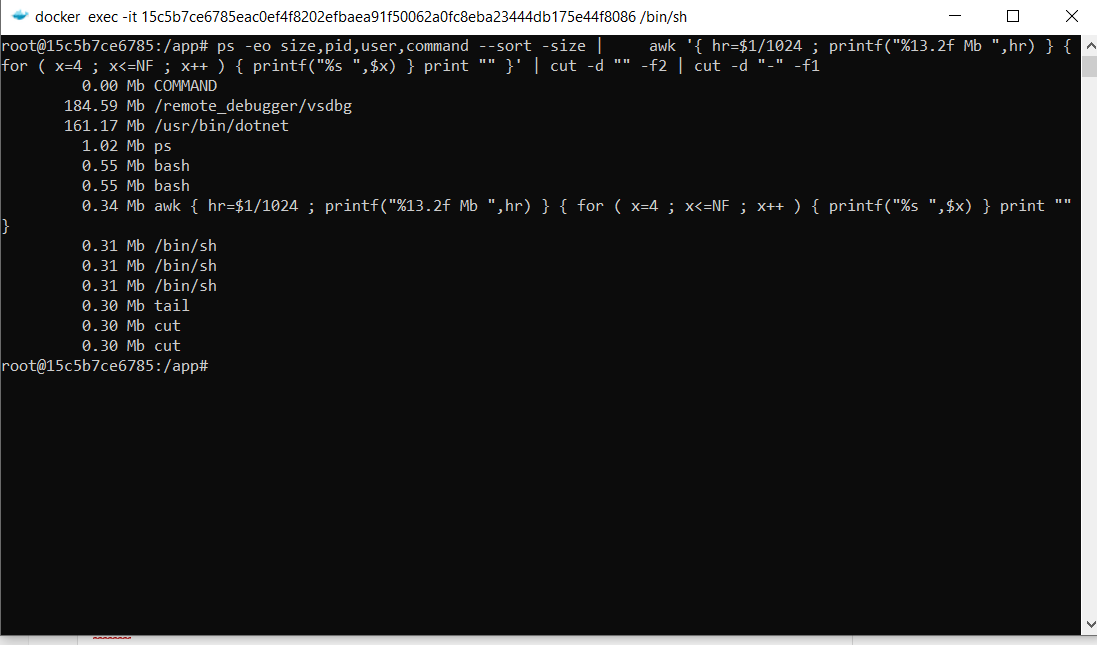
Running bash in the running container I will get the current memory usage.
ps -eo size,pid,user,command --sort -size | \
    awk '{ hr=$1/1024 ; printf("%13.2f Mb ",hr) } { for ( x=4 ; x<=NF ; x++ ) { printf("%s ",$x) } print "" }' |\
    cut -d "" -f2 | cut -d "-" -f1
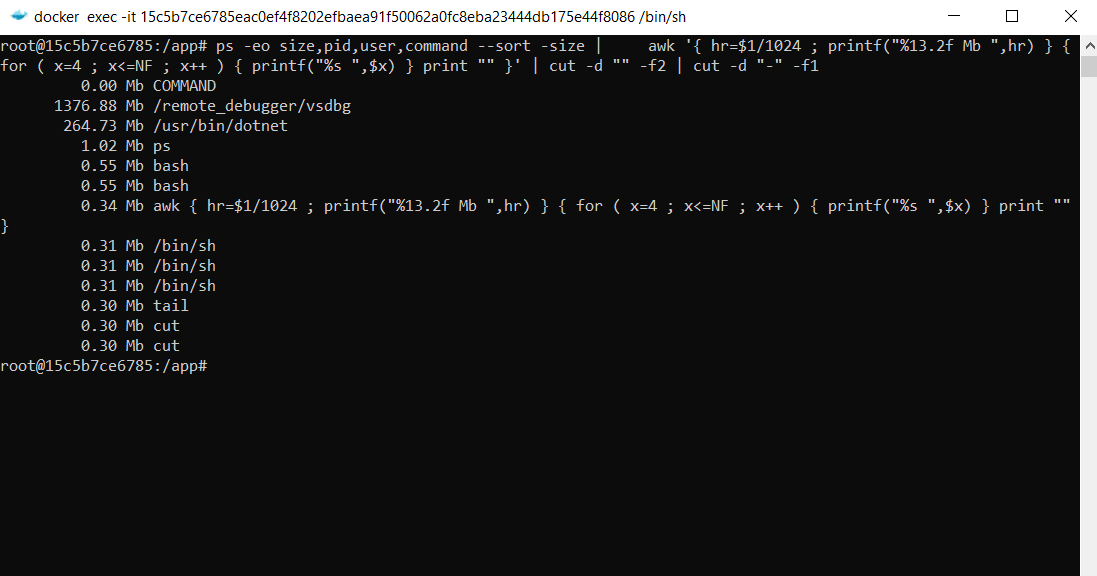
Then using bombardier as before, I will make 10000 requests to that endpoint.
bombardier -c 100 -n 10000 --method=POST --body="{\"Name\":\"Joe\", \"Age\": 100}" --header="Content-Type: application/json" https://localhost:32776/api/person
Now looking at the memory, the dotnet process memory has grown. Time to work out why.
To do this, you can use the gcdump tool. What is nice about this tool is that it saves the dump in a format that can be read on another platform. A normal .dmp file will have platform specific information and can only be analysed on the same platform that I was created on. So a linux docker dump can’t be used in windows. The gcdump format has a lot less information and is much smaller but it can be used across platform.
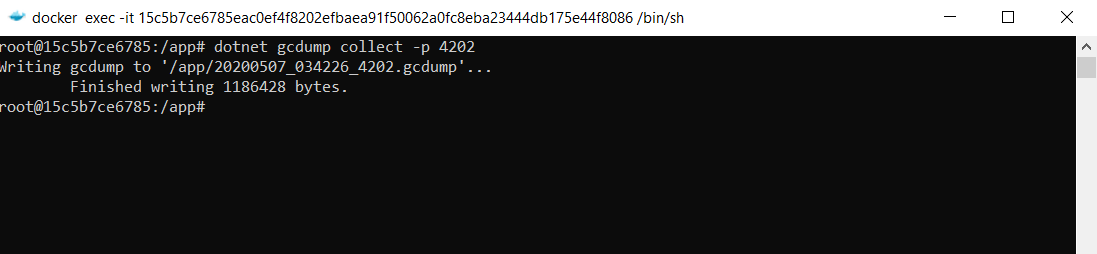
So once again, I use the ps command to get the pid of the application I want the dump on.
In this case it is 4202. I can then run a collect command on the pid to create a gcdump file.
dotnet gcdump collect -p 4202
The result of this is as follows:
Can you open this file directly in visual studio and get a count of each object count in memory. So ordering by total size you get the following.
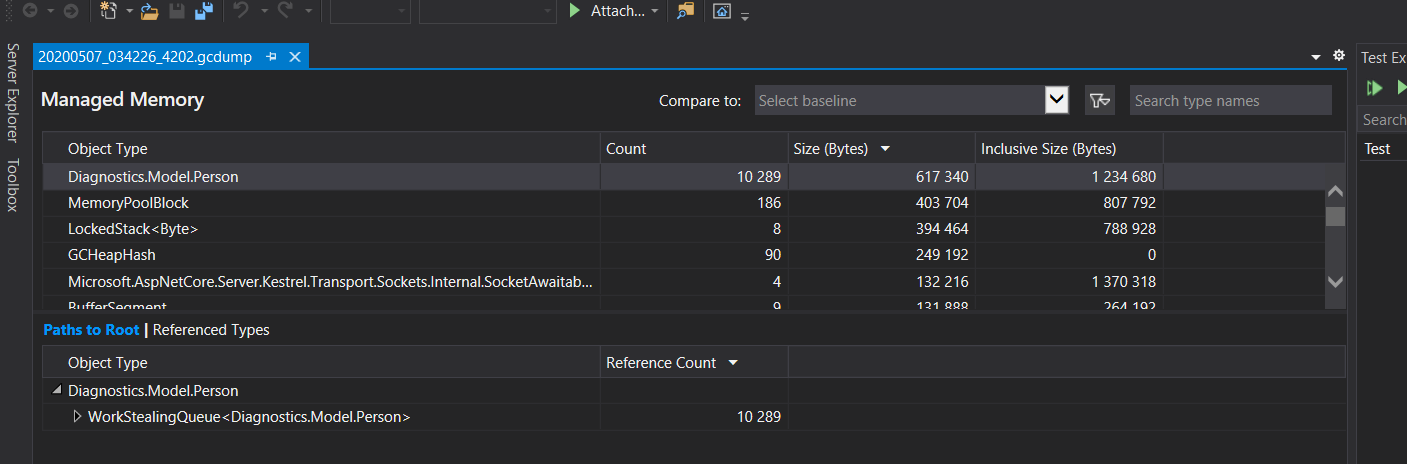
You can see that in this case its obvious where the extra memory is. This is great in some cases but it does get a bit trickier when its not a custom object and also not in a single place. If this doesn’t help then unfortunately the next step would be to do a local dump and use something like SOS. This is more powerful but also much more complex.