This is the second in a series of posts covering measuring a .Net Core application. If you want to try follow the code then you can have a look at this repo: Blog-Diagnostics.
This is the plan for the series. I will update this with links as it evolves.
- Setting up local diagnostics tools
- Using dotnet-counters
- dotnet-counters with a custom provider
- Using dotnet-gcdump to investigate memory leaks
- Creating a dump file when a ASP.NET Core application crashes
Now that the project is setup, I’m going to use the dotnet-counters tool to measure what is happening when the application is running.
First I will start checking which applications I can monitor with counters on the container shell.
/app# dotnet counters ps
        24 dotnet     /usr/share/dotnet/dotnet
       350 dotnet     /usr/share/dotnet/dotnet
        12 vsdbg      /remote_debugger/vsdbg
Even though its ambigious, the pid we are looking for is 24 since that is our running application.
Then I will run monitor against that pid to start watching the application.
dotnet counters monitor -p 24
This is what you see in response.
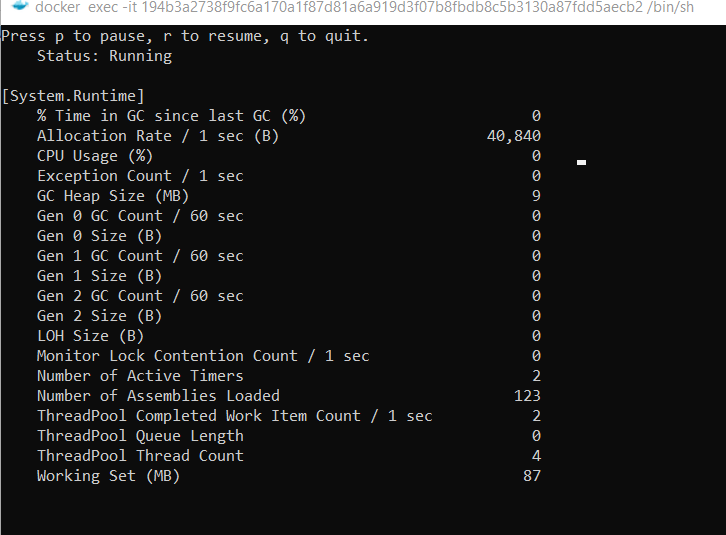
You will see some metrics from the System.Runtime provider. You can actually add whatever provider that is emitted. Two popular ones are System.Runtime and Microsoft.AspNetCore.Hosting
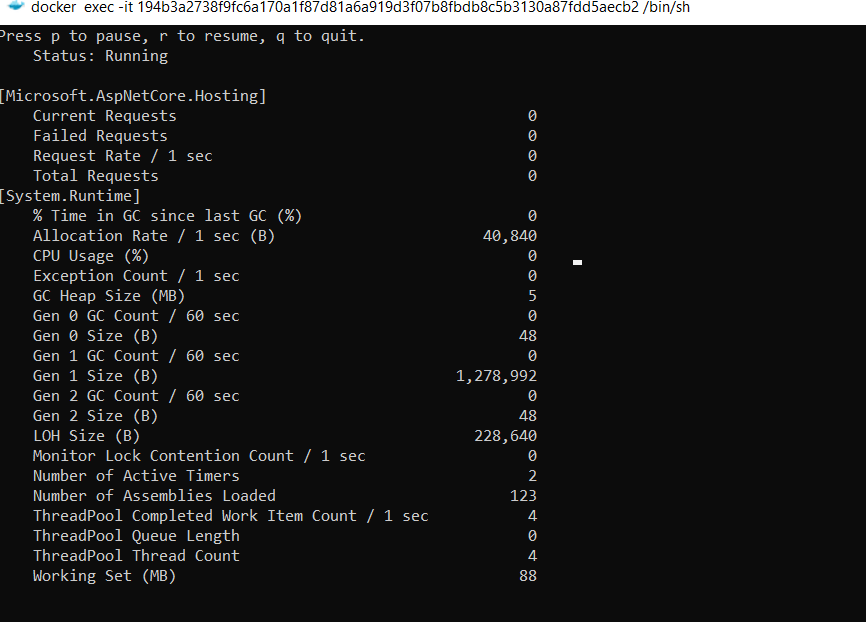
You can change the command to include them by changing it to.
dotnet counters monitor -p 24 --providers System.Runtime Microsoft.AspNetCore.Hosting
To make it interesting I’m going to use a tool called bombardier that can simulate many users connecting to the server at the same time.
bombardier -c 50 -n 10000 https://localhost:32770/api/person/steve

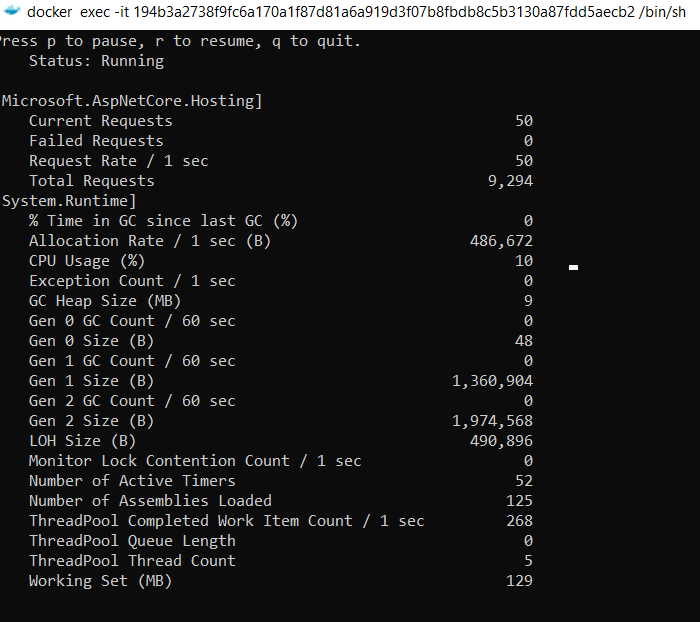
You can see quite interesting metrics while its running. You can use this to try judge if your memory and thread usage is working in the way you would expect across different loads.